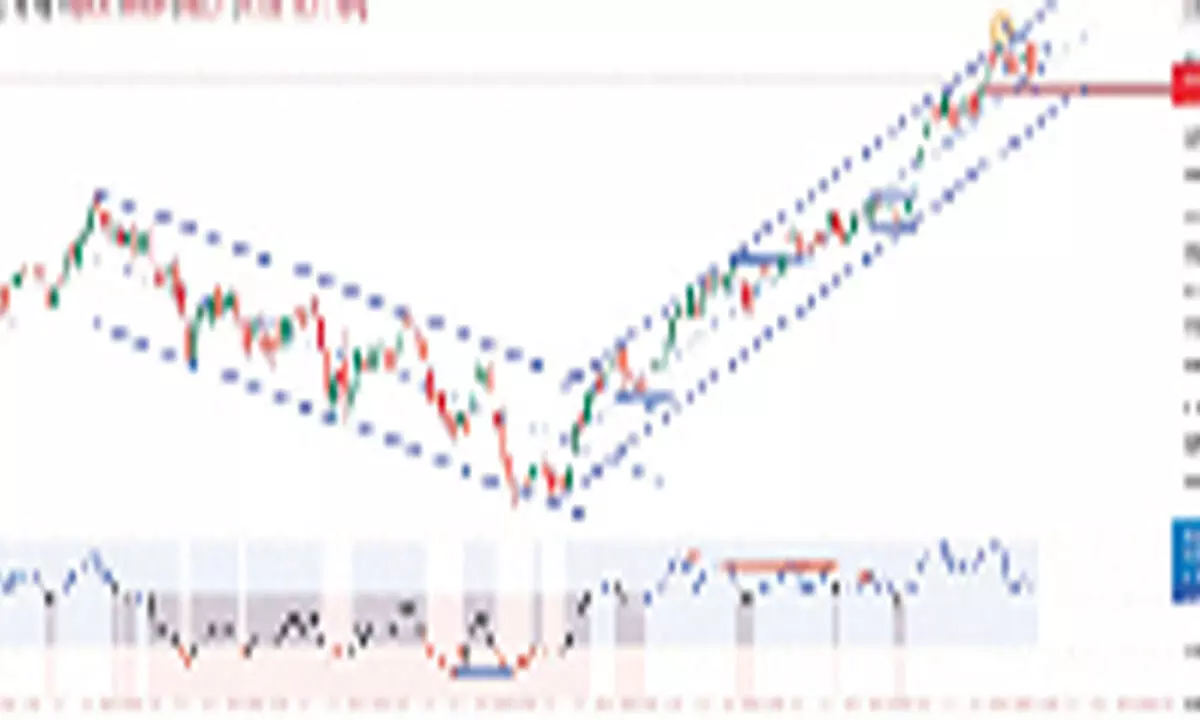
Nifty makes lower low and lower high

NSE Nifty ended its winning streak after gaining for four weeks. It traded in a narrow range of 304.45 points and settled with a decline of 98.95 points. BSE Sensex is down by 0.79 per cent. Midcap-100 and Smallcap-100 are up by 1.52 per cent and 0.61 per cent, respectively. Nifty Realty and the Pharma indices are the top gainers with 5.01 per cent and 4.82 per cent. On the flip side, the FMCG and Bank Nifty are down by 1.37 per cent and 1.32 per cent, respectively. On a daily chart, the index has formed a lower low and lower high. The Bollinger bands are contracting because of mean reversion. At the same time, the Nifty has reached exactly the middle range of the rising channel. The mean reversion is on a daily time frame is done, but on a weekly time frame, it is still in an expansion mode.
Currently, the Nifty is holding three distribution days. Any increase in the distribution day count will change the market status. In any case, the index closes below the 20DMA, the 19,577 points, which may be the beginning of a meaningful correction. In fact, the shooting star followed by an inside bar indicates a temporary halt for the uptrend. During the last week, the India VIX closed at a multi-year low of 10.14, declining by 11.75 per cent. This historical low indicates the market is at a swing high. Historically, the low VIX periods lead to a sharp profit booking. We can consider the previous week’s high of 19,992 points as an intermediate top; as long as it trades below 19,867 points, it is a strong resistance level. As we discussed earlier, the Nifty has to form four consecutive bearish candles. In the current uptrend, the Nifty never declined more than three days. It also never declined more than two per cent. Because of this reason, the 19577-867 zone is very critical for the directional bias. On the indicators front, the weekly RSI (71.06) is still in a mild over-bought zone and not showing any divergence. The weekly MACD histogram shows a slightly declined momentum. The daily RSI and MACD lines are declining from their higher levels. For the near term, the support levels are at 19577, 19245. Only below these levels we can test the major support zone of 19011-18800.


